


为使系统良好运转,Linux系统管理员经常需要监测cpu、内存、磁盘、网络等系统信息。Linux上已有iotop、top、free、htop、sar等丰富的常规工具来实现监测功能。今天让我们走进Collectl来了解这个集测试/监控/分析系统性能为一体的Linux工具。
Collectl作为一个轻量级的监控工具,在同类工具中是功能最全的。用户可监测不同的复杂系统矩阵值,并可保留数据以做之后的分析。不同于其他只用来监测特定系统参数的工具,Collectl可以同时监测不同的变量,并以合适的方式记录它们。
不同于或聚焦于一小组统计数据、采用唯一输出方式,或采用迭代、作为守护进程运行的大部分监测工具,collectl可以同时全部实现。用户可选择各种子系统中的任一系统来监测包括内存,CPU,磁盘,索引节点,无线带宽,lustre,内存,网络,网络文件系统,进程,二次型,slabs,套接口及TCP等信息。
深入学习前让我们先看以下命令。
- $ collectl
- waiting for 1 second sample...
- #<--------CPU--------><----------Disks-----------><----------Network---------->
- #cpu sys inter ctxsw KBRead Reads KBWrit Writes KBIn PktIn KBOut PktOut
- 0 0 864 1772 0 0 0 0 0 1 0 0
- 5 2 1338 2734 0 0 8 2 0 0 0 1
- 1 0 1222 2647 0 0 92 3 0 2 0 1
- 1 0 763 1722 0 0 80 3 0 1 0 2
CPU使用率,磁盘输入输出和网络活动以每秒为单位来加载。对可以理解这些数据的人来说这些信息很容易读懂。这项列表在给定的时间间隔里会持续增加,并可直接形成一项文件跟踪日志。collectl工具提供了各种命令来对这些数据进行记录,查找及做其他处理。
安装collectl工具
对Ubuntu/Debian用户来说Collectl是默认资源,所以使用apt命令便可获取。
- $ sudo apt-get install collectl
Fedora/CentOS用户使用yum命令便可获取。
- $ yum install collectl
使用
必要的了解 - Collectl子系统
子系统是可检测到的不同系统资源类型。像CPU,内存,带宽等等都可构成一个子系统。只运行collectl命令将以批处理模式输出CPU,磁盘和网络子系统信息,我们在上文已看到相关内容。
从操作说明可以看到,Collectl可以识别以下子系统。
- 总计子系统
- b - buddy info (内存片段)
- c - CPU
- d - Disk
- f - NFS V3 Data
- i - Inode and File System
- j - Interrupts
- l - Lustre
- m - Memory
- n - Networks
- s - Sockets
- t - TCP
- x - Interconnect
- y - Slabs (system object caches)
- 细节子系统
- 这是一系列的详细信息,大部分情况下都会由相应的总计数据衍生出来。目前“环境变量”和“进程”2类没有相应的总计数据。如果有3个磁盘,选择-sd,将只会看到3个磁盘组合出的单一信息。如果选择-sD,将会分别显示各磁盘信息。
- C - CPU
- D - Disk
- E - Environmental data (fan, power, temp), via ipmitool
- F - NFS Data
- J - Interrupts
- L - Lustre OST detail OR client Filesystem detail
- M - Memory node data, which is also known as numa data
- N - Networks
- T - 65 TCP counters only available in plot format
- X - Interconnect
- Y - Slabs (system object caches)
- Z - Processes
使用“-s”来监测特定的子系统并向其添加子系统的识别项。现在让我们举几个例子。
1. 监测cpu使用率
用“-sc”实现CPU总使用率的监测
- $ collectl -sc
- waiting for 1 second sample...
- #<--------CPU-------->
- #cpu sys inter ctxsw
- 3 0 1800 3729
- 3 0 1767 3599
使用“-C”观察各个单独的CPU使用情况。结果将会输出多行,分别对应一个CPU。
- $ collectl -sC
- waiting for 1 second sample...
- # SINGLE CPU STATISTICS
- # Cpu User Nice Sys Wait IRQ Soft Steal Idle
- 0 3 0 0 0 0 0 0 96
- 1 3 0 0 0 0 0 0 96
- 2 2 0 0 0 0 0 0 97
- 3 1 0 0 0 0 0 0 98
- 0 2 0 0 0 0 0 0 97
- 1 2 0 2 0 0 0 0 95
- 2 1 0 0 0 0 0 0 98
- 3 4 0 1 0 0 0 0 95
如果需要,可以同时使用C和c来获取单项CPU监测数据和汇总数据。
2. 内存监测
使用m子系统查看内存。
- $ collectl -sm
- waiting for 1 second sample...
- #<-----------Memory----------->
- #Free Buff Cach Inac Slab Map
- 2G 220M 1G 1G 210M 3G
- 2G 220M 1G 1G 210M 3G
- 2G 220M 1G 1G 210M 3G
不难解释。 M用来查看更多内存的详细信息。
- $ collectl -sM
- waiting for 1 second sample...
- # MEMORY STATISTICS
- # Node Total Used Free Slab Mapped Anon Locked Inact Hit%
- 0 7975M 5939M 2036M 215720K 372184K 0 6652K 1434M 0
- 0 7975M 5939M 2036M 215720K 372072K 0 6652K 1433M 0
这类似于免费报告吗?
3. 查看磁盘使用情况
d和D可以查看磁盘使用的概况和详细情况。
- $ collectl -sd
- waiting for 1 second sample...
- #<----------Disks----------->
- #KBRead Reads KBWrit Writes
- 4 1 136 24
- 0 0 80 13
- $ collectl -sD
- waiting for 1 second sample...
- # DISK STATISTICS (/sec)
- # <---------reads---------><---------writes---------><--------averages--------> Pct
- #Name KBytes Merged IOs Size KBytes Merged IOs Size RWSize QLen Wait SvcTim Util
- sda 0 0 0 0 0 0 0 0 0 0 0 0 0
- sda 0 0 0 0 0 0 0 0 0 0 0 0 0
- sda 1 0 2 1 17 1 5 3 2 2 6 2 1
- sda 0 0 0 0 92 11 5 18 18 1 12 12 5
“--verbose”命令可以用来查看附加信息。和D命令不同,它将概况扩展,包含了更多信息。
- $ collectl -sd --verbose
4. 同时报告多系统情况
如果想要同时得到CPU,内存和磁盘报告,那么同时使用子命令组合来实现。
- $ collectl -scmd
- waiting for 1 second sample...
- #<--------CPU--------><-----------Memory-----------><----------Disks----------->
- #cpu sys inter ctxsw Free Buff Cach Inac Slab Map KBRead Reads KBWrit Writes
- 4 0 2187 4334 1G 221M 1G 1G 210M 3G 0 0 0 0
- 3 0 1896 4065 1G 221M 1G 1G 210M 3G 0 0 20 5
5. 显示统计时间
若要将每行的监测信息和时间一同显示,使用T选项。通过在“-o”参数来指定。
- $ collectl -scmd -oT
- waiting for 1 second sample...
- # <--------CPU--------><-----------Memory-----------><----------Disks----------->
- #Time cpu sys inter ctxsw Free Buff Cach Inac Slab Map KBRead Reads KBWrit Writes
- 12:03:05 3 0 1961 4013 1G 225M 1G 1G 212M 3G 0 0 0 0
- 12:03:06 3 0 1884 3810 1G 225M 1G 1G 212M 3G 0 0 0 0
- 12:03:07 3 0 2011 4060 1G 225M 1G 1G 212M 3G 0 0 0 0
使用“-oTm”可将时间换成毫秒显示。
6. 改变样本计数
collectl报告的每行都是一份快照或样本,它通常设定定期间隔如1秒来取样。i可用来设置时间间隔,c用来设置样本计数。
- $ collectl -c1 -sm
- waiting for 1 second sample...
- #<-----------Memory----------->
- #Free Buff Cach Inac Slab Map
- 1G 261M 1G 1G 228M 3G
使用i命令可改变更新时间间隔。
- $ collectl -sm -i2
- waiting for 2 second sample...
- #<-----------Memory----------->
- #Free Buff Cach Inac Slab Map
- 1G 261M 1G 1G 229M 3G
上面的命令设定每2秒收集一次内存信息。
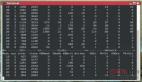
7. 像iotop一样使用collectl
top命令将collectl像iostat/top工具一样进行智能统计。列表会持续更新,且可以使用不同字段实现排序。
- $ collectl --top iokb
输出如下:
- # TOP PROCESSES sorted by iokb (counters are /sec) 09:44:57
- # PID User PR PPID THRD S VSZ RSS CP SysT UsrT Pct AccuTime RKB WKB MajF MinF Command
- 3104 enlighte 20 2683 3 S 938M 33M 0 0.00 0.00 0 00:09.16 0 4 0 0 /usr/bin/ktorrent
- 1 root 20 0 0 S 26M 3M 2 0.00 0.00 0 00:01.30 0 0 0 0 /sbin/init
- 2 root 20 0 0 S 0 0 3 0.00 0.00 0 00:00.00 0 0 0 0 kthreadd
- 3 root 20 2 0 S 0 0 0 0.00 0.00 0 00:00.02 0 0 0 0 ksoftirqd/0
- 4 root 20 2 0 S 0 0 0 0.00 0.00 0 00:00.00 0 0 0 0 kworker/0:0
- 5 root 0 2 0 S 0 0 0 0.00 0.00 0 00:00.00 0 0 0 0 kworker/0:0H
- 7 root RT 2 0 S 0 0 0 0.00 0.00 0 00:00.08 0 0 0 0 migration/0
- 8 root 20 2 0 S 0 0 2 0.00 0.00 0 00:00.00 0 0 0 0 rcu_bh
- 9 root 20 2 0 S 0 0 0 0.00 0.00 0 00:00.00 0 0 0 0 rcuob/0
上面的输出很像top命令,并且它以磁盘数量降序排列进程。
若只想显示上面的5项进程,可用以下命令实现。
- $ collectl --top iokb,5
若想学习上面的列表里哪些字段可以排序,使用如下命令:
- $ collectl --showtopopts
- 下面是应用于进程或数据的最高排序类型列表。某些情况下你可能会使用某一字段进行排序,但它并非显示的一部分。
- TOP PROCESS SORT FIELDS
- 进程排序字段
- Memory
- vsz virtual memory
- rss resident (physical) memory
- Time
- syst system time
- usrt user time
- time total time
- accum accumulated time
- I/O
- rkb KB read
- wkb KB written
- iokb total I/O KB
- rkbc KB read from pagecache
- wkbc KB written to pagecache
- iokbc total pagecacge I/O
- ioall total I/O KB (iokb+iokbc)
- rsys read system calls
- wsys write system calls
- iosys total system calls
- iocncl Cancelled write bytes
- Page Faults
- majf major page faults
- minf minor page faults
- flt total page faults
- Context Switches
- vctx volunary context switches
- nctx non-voluntary context switches
- Miscellaneous (best when used with --procfilt)
- cpu cpu number
- pid process pid
- thread total process threads (not counting main)
- TOP SLAB SORT FIELDS
- numobj total number of slab objects
- actobj active slab objects
- objsize sizes of slab objects
- numslab number of slabs
- objslab number of objects in a slab
- totsize total memory sizes taken by slabs
- totchg change in memory sizes
- totpct percent change in memory sizes
- name slab names
8. 像top一样使用collectl
为使collectl像top,我们只需以CPU使用率排序输出进程。
- $ collectl --top
输出如下:
- # TOP PROCESSES sorted by time (counters are /sec) 14:08:46
- # PID User PR PPID THRD S VSZ RSS CP SysT UsrT Pct AccuTime RKB WKB MajF MinF Command
- 9471 enlighte 20 9102 0 R 63M 22M 3 0.03 0.10 13 00:00.81 0 0 0 3 /usr/bin/perl
- 3076 enlighte 20 2683 2 S 521M 40M 2 0.00 0.03 3 00:55.14 0 0 0 2 /usr/bin/yakuake
- 3877 enlighte 20 3356 41 S 1G 218M 1 0.00 0.03 3 10:10.50 0 0 0 0 /opt/google/chrome/chrome
- 4625 enlighte 20 2895 36 S 1G 241M 2 0.00 0.02 2 08:24.39 0 0 0 12 /usr/lib/firefox/firefox
- 5638 enlighte 20 3356 3 S 1G 265M 1 0.00 0.02 2 09:55.04 0 0 0 2 /opt/google/chrome/chrome
- 1186 root 20 1152 4 S 502M 76M 0 0.00 0.01 1 03:02.96 0 0 0 0 /usr/bin/X
- 1334 www-data 20 1329 0 S 87M 1M 2 0.00 0.01 1 00:00.85 0 0 0 0 nginx:
上面的命令也可用于显示子系统信息。
- $ collectl --top -scm
9. 像ps一样列出进程
为像ps命令一样列出所有进程且没有后续更新,用“c”命令让其计数至1. $ collectl -c1 -sZ -i:1
上面的命令将会列出类似“ps -e”命令的所有进程。“procfilt”用于从所有进程中过滤出特定的进程信息。“procopts”用于指定另一组微调进程列表显示的命令。
10. 像vmstat一样使用collectl
Collectl有内置命令来完成像vmstat一样的功能。
- $ collectl --vmstat
- waiting for 1 second sample...
- #procs ---------------memory (KB)--------------- --swaps-- -----io---- --system-- ----cpu-----
- # r b swpd free buff cache inact active si so bi bo in cs us sy id wa
- 1 0 0 1733M 242M 1922M 1137M 710M 0 0 0 108 1982 3918 2 0 95 1
- 1 0 0 1733M 242M 1922M 1137M 710M 0 0 0 0 1906 3886 1 0 98 0
- 1 0 0 1733M 242M 1922M 1137M 710M 0 0 0 0 1739 3480 3 0 96 0
11. 子系统的详细信息
下面的命令以一秒为间隔,统计5次CPU信息并和时间一起显示出详细信息(冗长)。
- $ collectl -sc -c5 -i1 --verbose -oT
- waiting for 1 second sample...
- # CPU SUMMARY (INTR, CTXSW & PROC /sec)
- #Time User Nice Sys Wait IRQ Soft Steal Idle CPUs Intr Ctxsw Proc RunQ Run Avg1 Avg5 Avg15 RunT BlkT
- 14:22:10 11 0 0 0 0 0 0 87 4 1312 2691 0 866 1 0.78 0.86 0.78 1 0
- 14:22:11 15 0 0 0 0 0 0 84 4 1283 2496 0 866 1 0.78 0.86 0.78 1 0
- 14:22:12 17 0 0 0 0 0 0 82 4 1342 2658 0 866 0 0.78 0.86 0.78 0 0
- 14:22:13 15 0 0 0 0 0 0 84 4 1241 2429 0 866 1 0.78 0.86 0.78 1 0
- 14:22:14 11 0 0 0 0 0 0 88 4 1270 2488 0 866 0 0.80 0.87 0.78 0 0
改变"-s"变量查看不同的子系统。
总结
本文的介绍不过是对collectl这个强大工具的一些浅见。本文本希望展示它有多灵活,其实通过以上的讨论让我们了解了包括记录及回寻捕获的数据,以多种文件格式导出数据并将数据转换为可被广泛的工具分析的格式等等功能的实现。
collectl提供的另一大功能便是像服务一样运行,对远程Linux机器或完整的服务器集群提供远程监控,其表现堪称完美。
Collectl同另一批可用于处理分析收集数据的名为Collectl实用工具 (colmux, colgui, colplot)的功能相契合。如果有机会,我们在之后的文章中会介绍它们。
为更详细的了解Collectl工具,请登录它的主页来学习更多的功能。笔者建议查看FAQs来快速了解collectl,读取collectl文档获取深层次的例子。等价命令表也可定位至更多的像sar,iostat,netstat,top等和collectl功能部分等价的常用工具。
via: http://www.binarytides.com/collectl-monitor-system-resources-linux/
译者:icybreaker 校对:wxy